

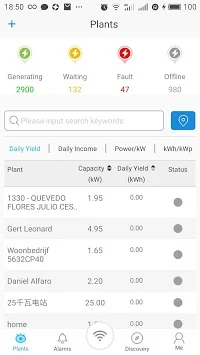
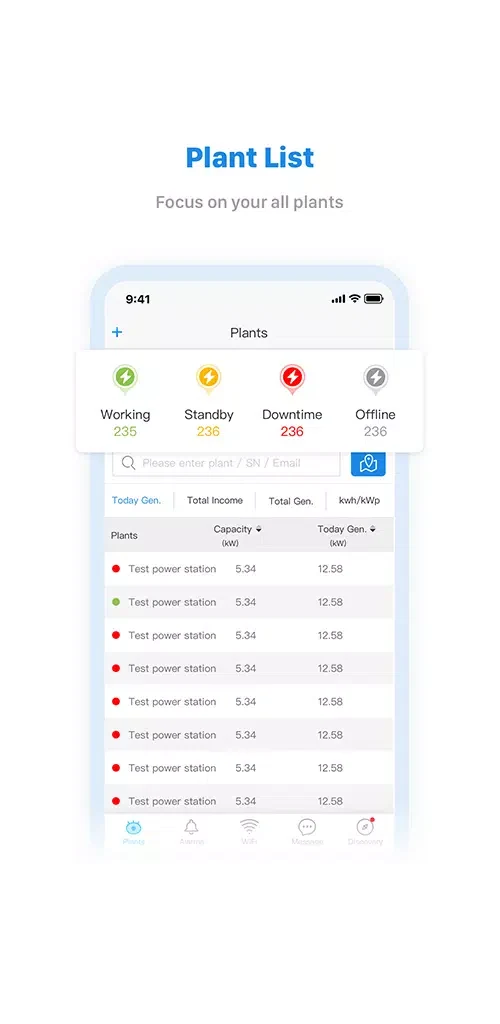
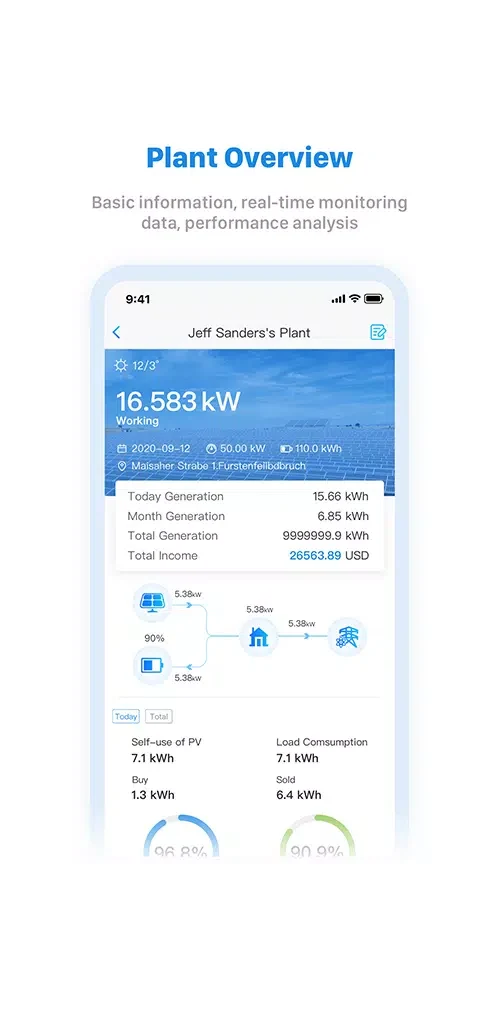
SEMS Portal provides monitoring views for solar installations, including current power generation, power consumption and grid-connected power. It is intended to help owners and people involved in operating, installing or servicing a system review its energy data and performance.
Reviewing system and inverter data
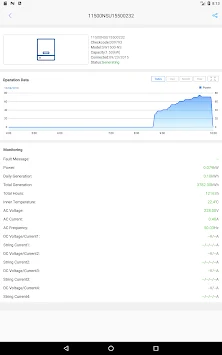
The main dashboard presents key system information, with daily power generation available from the main screen. Users can open the Inverter section to view more detailed inverter data. Together, these views provide a way to check daily output alongside information about the equipment, rather than relying only on a single generation figure.
The portal also presents energy-flow measures and power-generation trends. These figures can help users examine how generation relates to consumption and grid-connected power. The source describes the data as current, but does not specify how frequently each value refreshes, so the displayed measures should not be taken as a guarantee of a particular update interval.
Charts and viewing controls
Charts provide a visual view of power-generation trends and energy-flow metrics. Users can switch to landscape viewing for charts, which the source recommends when chart details are difficult to read. The source also notes that some users may find the text small; it does not describe additional display or accessibility controls.
Local currency settings and an export tariff function are also described. These settings relate to how energy information is presented, though the source does not explain the available currencies, tariff calculation, or how those values affect the displayed results.
Connecting an inverter
Getting started involves connecting the inverter to a home Wi-Fi network and entering details such as its serial number and verification code. The source notes that setup may take some learning and that the app does not include built-in instructions. It does not provide further connection steps or identify additional requirements, so those should not be assumed from this description.
Displaying data through Solarfox
The source also describes using GoodWe SEMS Portal data as a source in the separate Solarfox online portal. In that arrangement, a Solarfox screen can display current performance data, daily power generation and CO2 emission reductions. Users can add material such as sustainability projects, pictures or comments to the screen presentation. This is described as a Solarfox display setup, not as a display function built into the SEMS Portal Android app.
Checking system status
The source says SEMS Portal does not currently provide notifications for system problems, such as shutdowns or errors. Users therefore need to check the system manually if they want to look for such issues. It also reports that daily generation figures or units may sometimes appear incorrectly, possibly in connection with bugs or version updates; this is presented as a possible explanation, not a confirmed diagnosis.